|
|---|

![]()
Issues |
|
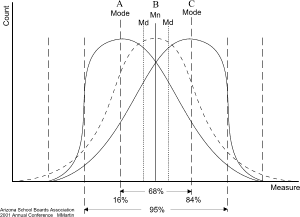
Martin's Comparadox by Michael T. Martin In addition to Martin's Paradox (i.e. the better your educational system, the more your students will score below average, and the farther their standardized scores will decline), there exists a more generic paradox involving skewed distributions: Martin's Comparadox. While politicians blithely compare average test scores between states and schools, once again they get it all wrong, because using averages for making comparisons between groups, between schools, between grades, and between years is meaningless. The culprit, once again, is the extent to which the shape of the measurement distribution forms a normal bell curve or the human "nose" shaped "skewed normal" distribution. When raw or standardized test scores are reported for groups of students, it is very rare for the median score to be reported at the same time. But you need to have BOTH scores to tell you whether the scores form a bell curve or a "left skewed" or "right skewed" distribution. If the mean and median are different, then the distribution is skewed in proportion to this difference. Suppose, for example, three different schools have identical average scores (Mn). School A has a median score (Md) well below the average score, while School C has a median score equally as far above the average score. School B (the dashed bell curve) has a median score exactly at the average score. Schools A & C have the exact same range of test scores, but School B has a small number of scores both above and below the range of scores in the other schools.
Having a median score substantially below the average tells us that most of the students in School A scored below average. As we noted in Martin's Paradox, it is possible for more than two-thirds of the students at School A to score below average. School C is skewed in the opposite direction of School A, and thus it is possible more than two-thirds of its students scored above the average. In other words, two-thirds of the students' scores for Schools A & C had no overlap. Only a third of the students in School A scored as high as two-thirds of the students in School C, and only a third of the students in School C scored as low as two-thirds of the students in School A. Yet all three schools had the same average! Now, suppose one high-scoring student from School C moves to School A. If that student's score was somewhere above the peak of School C, then School C's average would go down and School A's average would go up. School A would now have an average score above Schools B and C, while School C now had the lowest average score. It is quite possible for School A to have the highest average score even when two-thirds of its students scored below two-thirds of the students in School C. So, what does knowing the average test score of all three schools tell you? Absolutely nothing. How would you compare these schools even knowing both the mean and the median? There is no question that "most" students at School C scored substantially higher than "most" students at School A. Yet at School C there are many students whose scores are substantially below "most" of their other students and virtually none of their students excelled beyond the others. Meanwhile at School A there are virtually no students who lagged behind "most" of their other students and a substantial number scored especially well. Which school did the best job of teaching? What if School A is actually the same school as School C, but the two curves are gender differences? What if they are ethnic or racial differences? What if one is a pre-test and the other is a post-test for some new teaching method? What if both schools just barely qualified or escaped qualifying as a "failing school?" If the averages are the same but the medians are different, what does this tell you about the students or the teachers or the school? There may be no question that "most" of the students at School C have a greater level of knowledge than "most" of the students at School A, but I see no evidence that they gained this knowledge from being taught. I would interpret the graphs to mean the teachers at School A did a better job than those at School C even though "most" of their students scored lower than "most" of the students at School C. Almost none of the students at School C were taught to excel, it is as if they reached a level and then stopped. This could have been due to the "ceiling" effects of the test not measuring higher achievement, but how to explain the long tail of lower scores? Why were these students lagging behind the others? My own personal opinion is that "ceiling" effects should be expected in reading tests, but not mathematics tests. You can learn ever more exotic mathematics, but there is very little difference between good readers and the best readers. In reading, you would expect to see a distribution with no upper tail and a long lower tail. The lower tail would be comprised of both students who could not read well and students who could read but were not proficient in English. Conversely, you would expect to see the opposite distribution in mathematics because nearly all students should be able to master the basic concepts of math (math is the same in all languages) while even among students who have the same level of math knowledge, on a test, some students are very quick and adept at math while others are more plodding. Because of these different aspects of subject differences, I would suspect there are problems at a school that had an upper tail in reading or a lower tail in mathematics. At the same time, what would be suspect in history, or science, or geography? In general I would want to investigate any distribution that had a mean below the median, but that condition is not necessarily conclusive. In other words, unfortunately, you will have to use some intelligence in interpreting test scores. You can't do it by formula. Martin's Comparadox is simply that comparing average test scores among groups of students is absolutely meaningless without knowing the skew of the scores, and even knowing the skew may not tell you much. The "comparadox" of having different shaped test score distributions makes comparing average test scores between groups of students absolutely meaningless. If you cannot get a median score with each mean score, then you should simply toss the mean as meaningless. When you can get the median and mean, you must use them to assess the skew involved. If the difference between the mean and median is as little as one-third of the standard deviation then about two-thirds of your scores will be above/below average. Even then, you should be very careful interpreting them together. There is an example of Martin's Comparadox in the National Assessment of Educational Progress reading scores.
|