|
|---|

![]()
Issues |
|
The AIMS Mathematics Test by Michael T. Martin On September 27, 2000, Lisa Graham Keegan, a leading national authority on school test scores, and at that time the Superintendent of Public Instruction in Arizona touted as a Vice Presidential candidate for George W. Bush, issued a press release about the latest "AIMS test" results. The AIMS test was the "high-stakes" test she had championed in Arizona (Arizona Instrument to Measure Standards = AIMS). Her one page press release included these lines: "Keegan said she is concerned about what is happening to students in middle school, citing a decrease in mathematics achievement from 5th to 8th grade." The graphs that accompanied the press release showed vertical lines dividing the test scores for each of the grade levels in each of the subject areas into four regions, two above this 500 score corresponding to Meets the Standard and Exceeds the Standard, and two below 500 corresponding to Approaches the Standard and Falls Far Below the Standard. Distributed along with the press release was a package called "Guide to AIMS State Report" along with charts and graphs to illustrate the scores statewide. On page 6 of this "Guide to AIMS State Report" it reads: "The minimum scale score for Meets the Standard in each content area has been set at 500 for ease of interpretation." (italics in the original) Copies of the graphs for the "5th to 8th grade" mathematics scores lamented by Keegan are displayed below. If you look at the graph labeled "Grade 5 Mathematics" you can see the scores formed almost a symmetric bell curve. In the graph labeled "Grade 8 Mathematics", 50% of the students "Fell Far Below the Standard" and 34% of the students approached the standard, meaning that 84% of the students in 8th grade scored below the standard for mathematics. This is a rather precipitous fall considering that only 62% of the students were below the standard in the 5th grade.
But if you look at the shape of the 8th grade mathematics score distribution, where are the scores needing remediation? Why is there a pronounced aquiline nose to these scores? This is Martin's Paradox. By setting the average score to 500 when the average score has climbed well out onto the nose of a skewed distribution, it leaves only 16% of the students who score above the standard. But 16% is equal to the second and third standard deviations above or below the mean. In other words, the average score for the 8th grade mathematics test corresponds to one full standard deviation above what would have been the mean if the mean were at the peak of the distribution. When there are almost no students in the remedial tail of the bell curve, and the average has been extended well out onto the nose of the skewed distribution, you cannot tell me the schools are not doing a good job. You simply cannot get this type of distribution from a test of academic subjects without an excellent school program. A distribution of scores in the nose shape shown on the graph labeled "Grade 8 Mathematics" can only be achieved when the material has been covered to the extent that everyone knows most of the material and most of the students know a lot of the material. If they were taught poorly, there would be many who were clueless and some that didn't quite catch the material who would have formed the lagging remedial tail. But there is no lagging remedial tail. Ironically, since the Grade 8 Mathematics scores that Keegan decried resulted in only 16% of the scores being above average, this distribution corresponds almost exactly to the hypothetical distribution I used to explain Martin's Paradox. In other words, the seemingly extreme case where my hypothetical average score increased one full standard deviation above the mean, and the remedial tail declined from 16% of the students to 2%, and the upper tail increase from 16% to 30%, while two-thirds of the scores remained exactly the same, produced exactly the same distribution that Keegan decried as a failure of the public schools! Return to the revised Martin's Paradox
|
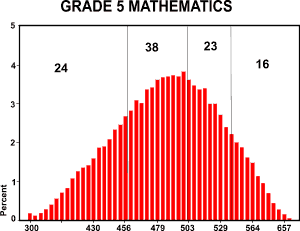 The number "24" in the left quadrant means 24% of the students "Fell Far Below the Standard." Adding the two left quadrants (24+38) shows that 62% of the students were below the standard.
The standard, of course, was a score of 500, which therefore is at the 62nd percentile. The median, consequently, is about one-third of the distance farther back toward the top of the bell curve. The graph is very close to a symmetric bell curve despite the difference between the mean and median.
The number "24" in the left quadrant means 24% of the students "Fell Far Below the Standard." Adding the two left quadrants (24+38) shows that 62% of the students were below the standard.
The standard, of course, was a score of 500, which therefore is at the 62nd percentile. The median, consequently, is about one-third of the distance farther back toward the top of the bell curve. The graph is very close to a symmetric bell curve despite the difference between the mean and median. 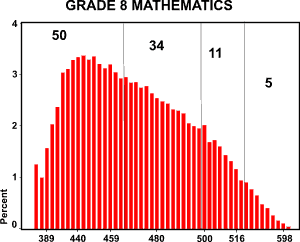 The Honorable Ms. Keegan's press release lamented "a decrease in mathematics achievement from 5th to 8th grade." Ms. Keegan spoke at length at her press conference about how middle school mathematics textbooks had been criticized nationwide for being "a mile wide and an inch deep" and that this was amply demonstrated by the AIMS scores.